Server Monitoring script
This script can be used for monitoring the server like RAM, Server Load, OS Version, Server IP, Swap space while login in ssh terminal and display the server status.
Step: 1
Copy the below codes into the script file
Example : vim /opt/monitor.sh(copy and paste below code into monitor.sh)
#!bin/bash
#Author Balakrishnan S from secueethics.com

Hostname=`hostname`
Users=`users`
Ram_Size=`free -h |grep Mem |awk '{print substr($2,0,length($2)-1)}'`
Swap_Size=`free -h |grep Swap |awk '{print substr($2,0,length($2)-1)}'`
Ram_used=`free -h |grep Mem |awk '{print substr($3,0,length($3)-1)}'`
Swap_used=`free -h |grep Swap |awk '{print substr($3,0,length($3)-1)}'`
Server_Load=`uptime |awk '{print substr($8,0,length($8)-1),substr($9,0,length($9)-1),$10}'`
Server_IP=`ip a |grep 172.27.221* |awk '{print substr($2,0,length($2)-3)}'`
CPU_load=`uptime |awk '{print substr($10,0,length($10)-3)}'`
OS_version=`lsb_release -d |awk '{print $2,$3,$4}'`
Support="admin@secureethics.com"

#Color Details
# Text Color Variables
BLK="\033[00;30m" # BLACK
R="\033[00;31m" # RED
GRN="\033[00;32m" # GREEN
BR="\033[00;33m" # BROWN
BL="\033[00;34m" # BLUW
P="\033[00;35m" # PURPLE
C="\033[00;36m" # CYAN
LtG="\033[00;37m" # LIGHT GRAY

DkG="\033[01;30m" # DARK GRAY
LtR="\033[01;31m" # LIGHT RED
LtGRN="\033[01;32m" # LIGHT GREEN
Y="\033[01;33m" # YELLOW
LtBL="\033[01;34m" # LIGHT BLUE
LtP="\033[01;35m" # LIGHT PURPLE
LtC="\033[01;36m" # LIGHT CYAN
W="\033[01;37m" # WHITE

RESET="\033[0m"

#set -x

## Ram Usage

if [ $Ram_used -eq $Ram_Size ];
then
Ram_status="$R"Critical""
Ram_used=`free -h |grep Mem |awk '{print $3}'`
else
Ram_status="$Y"Normal""
Ram_used=`free -h |grep Mem |awk '{print $3}'`
fi

###Swap space Usage

if [ $Swap_used -eq $Swap_Size ];
then
Swap_status="$R"Critical""
Swap_used=`free -h |grep Swap |awk '{print $3}'`
else
Swap_status="$Y"Normal""
Swap_used=`free -h |grep Swap |awk '{print $3}'`
fi

#set -x

###Cpu Load

if [ 5 -le $CPU_load ];
#if [ 5 -le 5 ];
then
CPU_status="$R"CPU_over_loaded""
else
CPU_status="$Y"Normal""
fi

#echo "$CPU_status"

#Load_15_Mins=`uptime |awk '{print $10}'`
echo -e $W "############## Server Status #############################################################"
#echo "########################################################### Server details ###################"
echo -e $BL" Build Server = `echo $GRN Please change here usage server` "
echo -e $BL" Server name = `echo $GRN $Hostname` "
echo -e $BL" Server IP Address = `echo $GRN $Server_IP` "
echo -e $BL" Server OS Version = `echo $GRN $OS_version` "
echo -e $BL" Server Load Average = `echo $GRN $Server_Load` Status = $CPU_status "
echo -e $BL" Server RAM Usage = `echo $GRN $Ram_used out of $Ram_Size GB` Status = $Ram_status "
echo -e $BL" Server Swap usage = `echo $GRN $Swap_used out of $Swap_Size GB ` Status = $Swap_status"
echo -e $BL" Currently login users = `echo $GRN $Users` "
echo -e $BL" Technical Support = `echo $GRN $Support` "
##echo " Server Load Average 15 Min= $Load_15_Mins "
echo -e $W "############################################################# Server Status ##############"
echo -e $RESET
Step: 2
schedule the cron job for server performance update status and output redirect to /etc/motd
Note :
cron job update the /etc/motd file every 1 min once
![]()
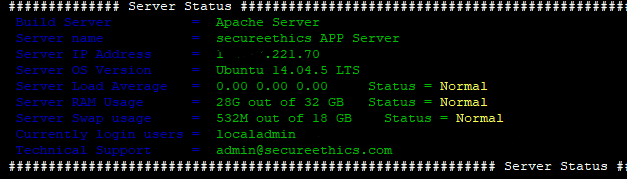
Step: 3
Once login through ssh the server and you will get the server status like below.